GC has run, but RAM it hasn’t decreased. Where did the garbage go?

Minh Khoa
Author
 Open the Profiler, call
 GC.Collect(), RAM is still high. Call it a few more times to be sure… still the same.
Wait before concluding GC isn’t working. The object may have been reclaimed, but you are looking at a different number.
Clearing items out of a warehouse does not necessarily make the warehouse smaller
GC reclaims the memory of C object# that are no longer referenced, so that space can be used for the next allocation. Unity describes the mechanism GC.
Illustrative example:
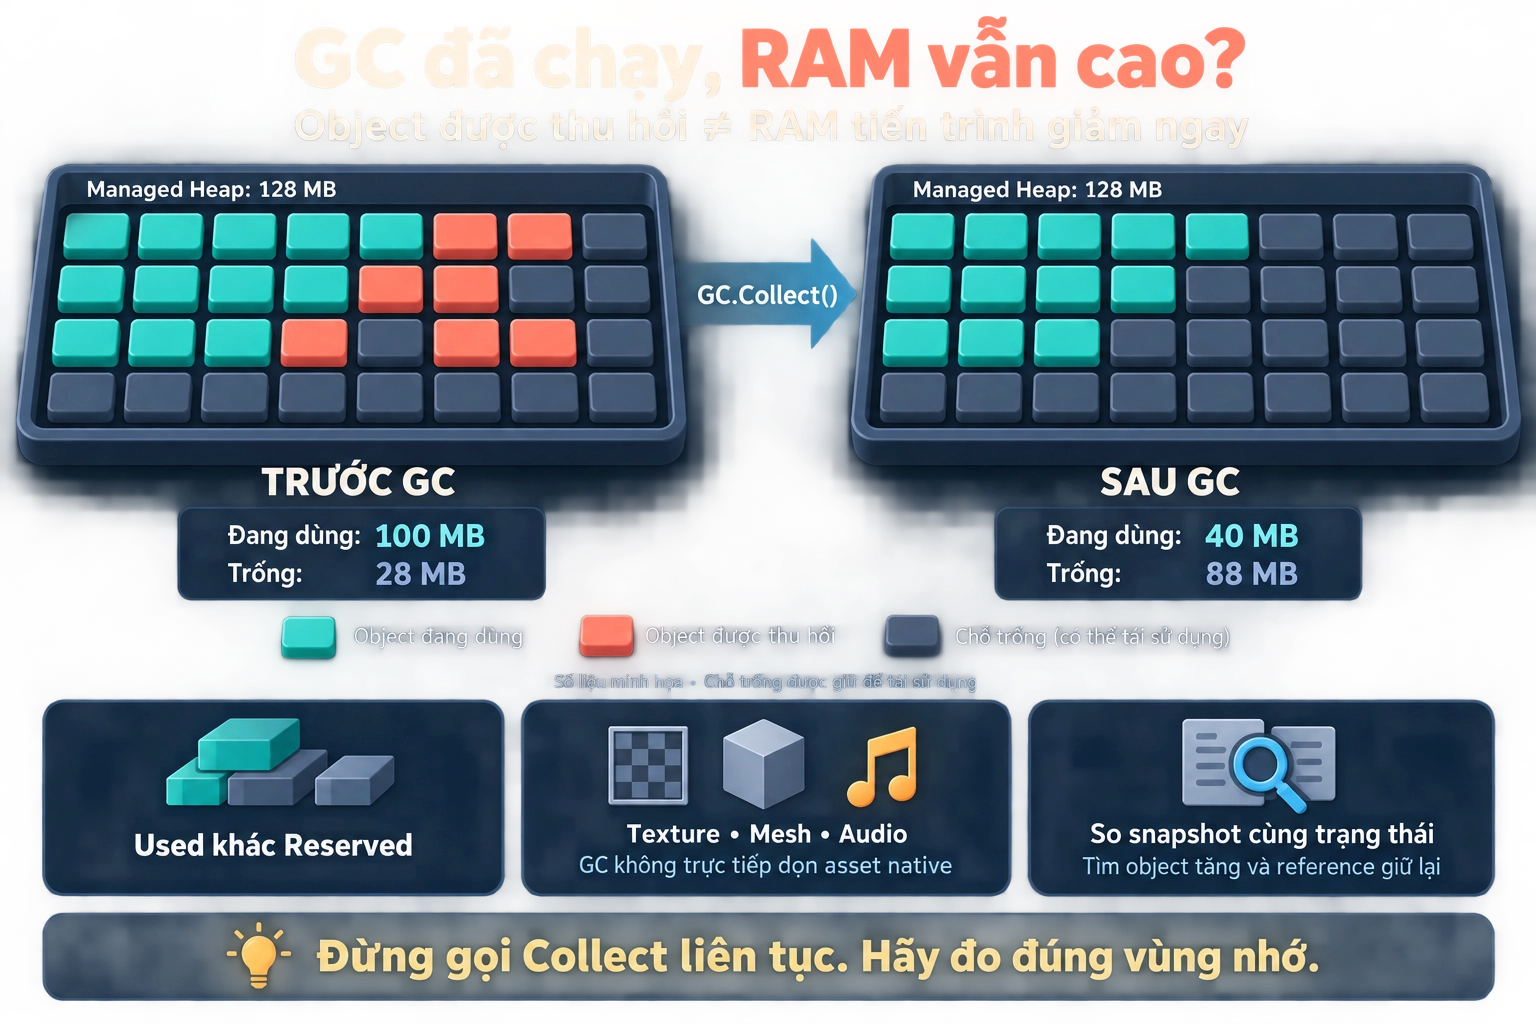
| Managed Heap | Before GC | After GC |
|---|---|---|
| Capacity retained — Reserved | 128 MB | 128 MB |
| Object footprint — Used | 100 MB | 40 MB |
| Reusable free space | 28 MB | 88 MB |
GC reclaimed 60 MB. But the heap still retains 128 MB to serve later allocations.
It’s like clearing out some goods in a warehouse: the inside is more spacious, but the warehouse area has not changed.
It is also not correct to say that Unity “never returns memory to the OS”. Free memory pages can be returned on many platforms, but the timing is not guaranteed. Unity Manual.
RAM of the game there is more than just C object#
Texture, Mesh, Audio, graphics memory, runtime metadata… all contribute to process memory. The Reserved figure in Unity does not necessarily correspond to RAM physical memory that the operating system is tracking. Memory Profiler.
For example: the game still keeps hundreds of MB texture after leaving a level. Calling GC.Collect() does not replace releasing or unloading those assets.
On the other hand, if a static List still keeps C object#, they are still considered alive. GC even a correct run cannot reclaim them. How to GC determine whether an object is still alive.
How can you check correctly?
I’ll start with two questions:
- Has Managed Used decreased after GC ?
Profiler.GetMonoUsedSizeLong()indicates the memory occupied by objects, including uncollected garbage. - Has Managed Reserved stayed the same?
Profiler.GetMonoHeapSizeLong()indicates the heap capacity being retained. It is normal for these two figures to differ. Profiler API.
Do not take Total Reserved − Managed Heap and treat it as the entire Native RAM: the statistics scope is not as complete as that subtraction suggests.
If you suspect a leak, try a validation pass on a real device:
- Go to the menu, wait for loading to finish, and capture snapshot A.
- Enter a match, play, then return to the menu.
- Wait for the cleanup process to complete, capture snapshot B, and compare.
- Repeat a few times, look for object groups that keep increasing, and see which reference is holding them.
Memory Profiler supports snapshot comparison. However, an object appearing newly is not necessarily a leak: it could be a legitimately created cache or pool. Guide to comparing snapshots.
What is worth investigating is memory that increases after each playthrough and does not stabilize again. As for RAM staying still after one GC, that alone does not prove there is a bug.
Before calling it one more time Collect(), see which memory is increasing and what is holding it.